What the Austin Housing Market Actually Looks Like for Buyers and Renters in Summer 2026
ABOR data and two local agents lay out a split-screen reality: tight inventory along South Congress, months of surplus in Pflugerville, and a rent-vs.-buy calculation that hasn't gotten easier desp…

ABOR data and two local agents lay out a split-screen reality: tight inventory along South Congress, months of surplus in Pflugerville, and a rent-vs.-buy calculation that hasn’t gotten easier despite falling prices.
Two Houses, Same Metro, Completely Different Markets
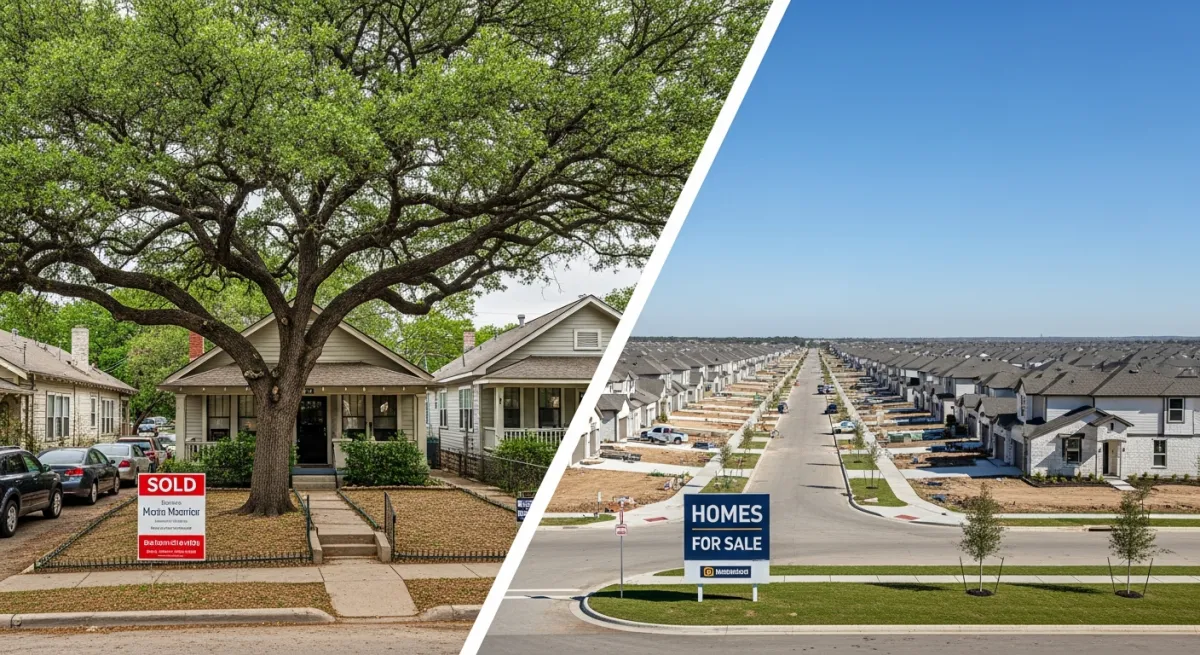
A three-bedroom bungalow on Juanita Street in Bouldin Creek went under contract eleven days after hitting MLS in late June. Asking price: $719,000. Final sale: above list, two backup offers, no seller concessions. Half a mile from South Congress Avenue, in a walkable corridor with mature trees and real restaurant density, it moved the way central Austin properties moved in 2021. Fast, competitive, unforgiving to anyone who paused to think.
Meanwhile, a four-bedroom new build on Northfield Lane in Pflugerville has had a “Price Reduced” sign out since mid-May. Started at $398,000, dropped to $379,000, still sitting as of early July. The builder—a Taylor Morrison community northeast of 130—is offering a 4.99% rate buy-down and $10,000 in closing cost credits to pull traffic. Showings have been slow.
Both homes are in the Austin metro. Neither story is wrong. The error is treating them as the same market.
This is what Austin looks like in summer 2026: not a single correcting or recovering market, but a geographic patchwork where the tools and expectations that work in one ZIP code will sink you in the next county over. Buyers shopping on metro-wide headlines—median price stabilized, inventory up slightly, rates still elevated—are working with the wrong map. Here’s a more accurate one.
Are Austin Home Prices Still Falling, or Has the Correction Run Its Course?
The short answer: it depends entirely on where you’re looking.
The Austin Board of Realtors June 2026 report puts the Travis County median home price at approximately $525,000, down from the May 2022 peak of roughly $667,000 and up modestly from a 2024 low that briefly touched the high $490,000s. That’s a correction of more than 20% from peak—a meaningful number—but it hasn’t been distributed evenly across the metro, and it hasn’t resolved the affordability problem that drove so much post-pandemic anxiety. Those two facts together are basically the whole story.
Prices in central Austin’s walkable corridors—78704 (Bouldin Creek, Travis Heights, South Congress), 78702 (East Austin), and 78703 (Tarrytown, Clarksville)—have stabilized. In parts of 78704, they’ve crept back toward 2022 levels. The demand drivers are structural: constrained land, established neighborhood character, walkability scores that suburban markets simply can’t replicate, proximity to employers along MoPac and 183. Supply in these ZIPs hasn’t expanded meaningfully, and what the HOME initiative has added hasn’t yet shown up in volume.
Williamson County tells a different story. The Georgetown (78628) median has retreated from its 2022 highs and keeps softening. Round Rock (78664) and Cedar Park (78613) are in similar shape, with active inventory at levels not seen since before the pandemic surge. The wave of permits DR Horton, Meritage Homes, and Taylor Morrison pulled in 2022 and 2023 kept delivering finished product through 2024 and into 2025. That supply is still absorbing demand that hasn’t grown fast enough to keep pace.
At current 30-year fixed rates—holding around 6.7% to 6.9% through late spring, per Freddie Mac weekly survey averages—a household buying a median-priced Travis County home at $525,000 with 10% down carries a principal and interest payment around $3,100 to $3,200 per month. Add Travis Central Appraisal District’s effective property tax rate (approximately 1.8% of assessed value in most of Travis County, though it varies by municipality and MUD district) and homeowner’s insurance, and the full housing payment climbs well above $4,000 monthly for most buyers. Qualifying at conventional debt-to-income ratios requires gross household income somewhere north of $130,000. Prices have come down; rates haven’t. Austin is cheaper than it was at the peak, but it remains expensive in any absolute sense, and anyone telling you the affordability problem is solved because prices corrected 20% is doing optimistic math.
The Inventory Map: Where Supply Is Piling Up and Where It Isn’t
Pull up the ABOR active listings by ZIP code and the split is immediately visible.
In 78704, available inventory as of the June report sat below two months of supply—firmly in seller’s market territory. Same for 78702, where proximity to downtown employers keeps listings competitive, and 78703, where the Tarrytown and Clarksville premium makes inventory perennially scarce. The overall metro correction has reinforced these ZIPs rather than loosened them.
Travel north and east and the numbers invert. Pflugerville (78660) is running around five to six months of supply in the resale market, with new construction communities adding further pressure. Georgetown (78628) sits in a similar range. Cedar Park (78613) and Round Rock (78664) have bounced between four and six months across 2025 and into 2026. Hays County—Kyle and Buda specifically—looks comparable, driven by the same new-construction pipeline.
The mechanism here matters. The DR Horton, Meritage, and Taylor Morrison communities that pulled permits in 2022 and early 2023 have been delivering finished homes on a lagged schedule, right through the correction period. Those homes hit the market as the buyer pool was already thinner than builders anticipated. Resale sellers in these same suburbs are competing against brand-new product with warranty coverage and builder financing packages. That’s a structural drag on resale absorption, not a seasonal soft patch.
Builder incentives deserve real scrutiny, not just a quick glance at the flyer in the sales office. A rate buy-down that saves $400 per month over two years is genuine money. But buyers should read the underlying purchase prices carefully. Some builder list prices have been held artificially high so the incentive looks more dramatic than it is. In a market with surplus inventory and motivated builders, there’s room to negotiate both price and incentives simultaneously—a good buyer’s agent will run that math.
The HOME initiative’s infill production in central Austin merits attention, though its scale is still modest relative to the overall market. Austin DSD permit data through spring 2026 shows an uptick in ADU and small multifamily permits in 78704, 78745, and 78721. This will add units—not imminently, but it’s visible in the 2027 and 2028 pipeline. For a detailed look at what Austin’s ADU rules actually allow and what it really costs to build one, the permitting and cost picture has become clearer since Phase 2 took effect.
What Days on Market Is Actually Telling You Right Now
Metro-wide days-on-market figures are among the least useful numbers in Austin real estate coverage this summer, and most market reports lead with them anyway. The June ABOR data shows the metro-wide average DOM in the mid-40s—elevated compared to the sub-10-day frenzy of 2021 and 2022, but not alarming historically. The problem is that number averages a Bouldin Creek property that sat for eight days against a Pflugerville listing that’s been up since April. Both contribute to the same average. Neither tells you what the other means.
Here’s something the aggregates also won’t tell you: Austin’s July heat is brutal. Actual measured highs have been at or above 100°F on the majority of days this month, and showing traffic drops measurably when the daily high exceeds 102°F. Buyers are less willing to trudge through open houses in that heat—honestly, can you blame them? Saturday afternoon showing windows have compressed. A home that goes 45 days in this July is not the same as 45 days in a March or October market. With better timing, the same home might have moved in 25.
The school-calendar deadline has also passed. Buyers who needed to close before AISD, RRISD, or Georgetown ISD calendars started had a hard deadline in late July. Families who missed that window have largely stepped back and will re-enter in September, when there’s room to make decisions without academic-year pressure. August in Austin is historically the deadest showing month of the year, and 2026 is no exception. A listing that starts in August begins with a structural headwind regardless of its other merits.
Both agents interviewed for this piece use DOM aggressively in negotiation—but in opposite directions depending on the submarket. In central Austin, 30 days on market is approaching the threshold where sellers might soften slightly; that’s your opening to ask for an inspection repair credit or get closing costs covered. In Pflugerville or Georgetown, 45 days is barely the starting point. The conversation there begins with whether the seller will compete with builder incentives, and it usually includes a list price negotiation.
Travis County Specifically: Buyer’s Market, Seller’s Market, or Neither?
The most direct question buyers ask—and the one that should actually determine offer strategy—is a leverage question: who needs the deal more?
Travis County sits near the four-month supply mark in June 2026, which technically touches the lower edge of balanced-market territory. But that county-wide number conceals the internal divide. Central Austin ZIPs are closer to two months; outer Travis County areas, including parts of Del Valle and eastern Travis, run higher.
Williamson County is clearly a buyer’s market on aggregate: five-plus months of supply, new construction adding to the pile. The county line matters. Buyer leverage in Georgetown or Cedar Park doesn’t transfer to a property in 78704. I’ve talked to buyers who made exactly this mistake—showing up to a central Austin multiple-offer situation with suburban-market expectations and walking away bewildered.
In central Austin, contingencies are more survivable in late summer than they were in spring. The heat lull means sellers are more tolerant of inspection and financing contingencies than they were in March. That window will close again in September when the fall buyer cohort returns.
In suburban markets, inspection concessions are realistic, nearly expected. Sellers who’ve been sitting 60-plus days know the next buyer may be their best shot before fall. Agents report that $5,000 to $10,000 in repair credits, seller-paid closing costs, and leave-behind appliances are all available in Pflugerville and Kyle without much resistance.
Builders present their own variable. Buyers comparing a Cedar Park resale against a DR Horton new build nearby should understand that builder incentive terms—the headline rate buy-down especially—are typically set at the corporate level and don’t move. But base price and lot premiums often have more flexibility than the sales office initially suggests. Bringing an independent buyer’s agent, rather than using the builder’s in-house rep, preserves your representation and sometimes yields additional concessions. The builder’s agent works for the builder. That’s not a knock on them; it’s just how the arrangement works.
The Renter’s Side of the Ledger
Renters aren’t a footnote here. A meaningful share of Austin’s population won’t be buying at current prices and rates regardless of where the market sits, and renter conditions have shifted substantially since the 2022-2023 peak.
Austin Apartment Association data through mid-2026 puts metro vacancy at approximately 9% to 10%—substantially above the sub-5% readings from 2022, a direct result of the same new-supply wave that hit the ownership market. Rents have come down. A two-bedroom in the Domain corridor (78758) that touched $2,400 or more in 2022 is leasing in the $1,850 to $2,050 range now, with concessions—free first month, reduced deposits—available at many Class A properties. The East Riverside/Montopolis corridor (78741), which serves part of the Tesla Gigafactory and Del Valle workforce, has seen similar softening, with two-bedrooms averaging closer to $1,400 to $1,600 depending on vintage.
Mueller has held rent levels better than the Domain corridor, owing to its mixed-income mandate and walkable design. Product turnover is lower there, and the location premium is real. Two-bedrooms sit around $1,900 to $2,100 for newer units.
The rent decline appears to have mostly run out of road. New lease-up velocity has absorbed the worst of the concession pressure, and multifamily construction starts have slowed considerably from 2022-2023 levels. The pipeline that drove vacancy higher is thinning. Rents aren’t rising fast, but the window for aggressive renter negotiation is narrowing. If you’ve been putting off asking your landlord for a concession, that conversation is getting harder, not easier.
A household earning $120,000 a year in Austin faces a stark comparison. Rent a two-bedroom in a desirable central or north Austin location for $1,700 to $2,000 per month, or buy a modest single-family home at the Travis County median—$525,000, 10% down—and carry a monthly payment covering principal, interest, taxes, insurance, and likely an HOA in the $4,200 to $4,500 range. That’s a gap of roughly $2,200 to $2,700 per month. Buying builds equity and caps your housing cost inflation; renting keeps your options open and your cash liquid. Reasonable people land differently on that tradeoff depending on their situation. For a full breakdown of how those numbers play out over a five-year horizon, our rent-versus-buy analysis for Austin in 2026 runs the math across several income and down-payment scenarios.
What tends to surprise people most is the property tax number. The effective rate on a $525,000 home in Travis County—after the homestead exemption—generates an annual tax bill of $7,000 to $9,000 depending on assessed value and whether you’re in a MUD or PID district. That’s $600 to $750 per month before the mortgage starts. Run the actual math before you run the emotional math.
What Two Independent Austin Buyer’s Agents Are Telling Clients
Two buyer’s agents, both working exclusively on the buy side and unaffiliated with any builder or large brokerage team, responded to the same four questions. Neither was given the other’s answers before responding.
The first agent, who works primarily in central and east Travis County, said 78721—the northeastern edge of East Austin, near the airport—has gotten noticeably more competitive since spring. “We used to have room there. Now I’m seeing situations where we’re going over ask on smaller houses priced under $500,000. The buyer pool that can’t afford deeper East Austin is moving east, and 78721 is absorbing that.” She noted that 78744, the South Austin southeast corridor, has quieted slightly compared to early 2026. “More listings, slightly more days, sellers who are willing to talk.”
The second agent, who focuses on the northern suburbs and Williamson County, said Georgetown’s 78628 has changed noticeably over the past 90 days. “Georgetown sellers spent two years believing they were insulated from the correction because their prices held longer. Now they’re seeing neighbors cut by $20,000 or $30,000 and finally accepting it. That’s actually making it a better negotiating environment.” There’s something almost predictable about that pattern—the suburbs that resisted the correction longest are now the ones where sellers are finally coming to terms with where the market actually is.
On concessions, the picture diverges sharply. In central Austin, inspection repair credits of $3,000 to $6,000 are achievable without killing deals, primarily on properties that have been sitting at least 21 days. Closing cost contributions are harder. Sellers in 78704 and 78702 who’ve held since before 2020 have substantial equity cushion and don’t need to move on price. In suburban markets, the dynamic flips. “Basically whatever you ask for if you’re a clean, qualified buyer,” the second agent said. “I just helped a client get $15,000 off list, all closing costs, a home warranty, and the seller left the refrigerator, washer, and dryer. In Pflugerville. Seller had been sitting 70 days.” He noted that an underwritten pre-approval—not a pre-qual letter—is increasingly important, because suburban sellers who’ve had contracts fall through are skeptical of buyer financial strength in ways they weren’t two years ago.
On builder incentives, both agents gave versions of the same answer: the rate buy-down is real money, but the underlying purchase price often carries a premium that partially offsets the benefit. “I had a client compare a DR Horton new build in Georgetown at $389,000 with a 4.99% buy-down against a resale three blocks away at $355,000,” the second agent said. “When you run the math over five years—accounting for the buy-down exhausting after two years, and the resale having a bigger lot and actual trees—the resale was the better deal. But only if my client could negotiate a repair credit and the seller accepted below ask. Which they did.” Builder incentives are worth taking seriously. They just always require a direct comparison against nearby resale, not a comparison against the advertised rate without the buy-down.
When asked what they tell a client deciding between Cedar Park and East Austin, the answers went in completely different directions. “It’s not really a housing decision,” the first agent said. “It’s a lifestyle decision that has housing implications. Cedar Park gets you more square footage, newer construction, better schools by certain metrics, and a longer commute to most Austin employment. East Austin gets you walkability, cultural density, restaurant access, and a smaller, older house for often more money. If they have young kids and value space and school ratings, Cedar Park makes sense. If they’re in their 30s, work downtown or hybrid, and want to walk to a coffee shop, the East Austin premium is a real thing they’ll actually use every day.” That’s the most useful framing I’ve heard for this metro’s internal geography in a while.
The second agent offered the practical version: “Cedar Park right now is a buyer’s market. East Austin is not. So some of it is just leverage. In Cedar Park, I can negotiate. In East Austin, I’m probably competing.”
The HOME Initiative and What It Means for Central Austin Supply
Austin’s HOME initiative—the zoning reform that eliminated single-family-only zoning citywide—is the most significant structural change to central Austin’s supply picture in a generation. Phase 1 took effect in late 2023; Phase 2 extended and clarified the rules. Austin DSD permit data through spring 2026 shows a measurable increase in small-scale multifamily permits—triplexes, fourplexes, ADUs—in ZIP codes where infill pencils out economically: 78704, 78745, 78721, and 78722 are seeing the most activity. The numbers remain modest in the context of the overall housing stock. Hundreds of units entering the pipeline, not thousands. But the direction is clear.
The more telling question is what these units look like when they deliver. Early HOME infill in 78704 and 78721 has skewed toward market-rate product—smaller footprints, not cheap prices—targeting the same demographic that already finds these neighborhoods desirable. A 950-square-foot condo in a new Bouldin Creek triplex permitted under HOME rules is not going to solve Austin’s workforce housing problem. It adds inventory at the margin and may moderate price growth in specific blocks over time. Anyone expecting a supply-driven affordability breakthrough in central Austin should push their timeline to 2028 or 2029 at the earliest, and even that assumes construction costs and interest rates cooperate in ways they currently don’t.
For renters, the more interesting question is whether for-rent infill—small apartment buildings rather than for-sale condos—emerges as a product type at meaningful scale. That depends on rate trajectory and construction costs as much as zoning, and neither has moved in ways that make small rental infill highly viable right now.
What This Means in Practice
Austin home prices have come down more than 20% from the 2022 peak, but the correction has run its course in central Austin while it’s still working through suburban markets. The metro is not one market. That’s been true for a while, but the gap between central and suburban conditions is unusually wide right now, which makes it matter more than it usually does.
Travis County’s central corridors: tight inventory, qualified buyers competing for the same homes, modest concession expectations. Williamson County and the outer suburban ring—Pflugerville, Georgetown, Cedar Park, Kyle—offer genuine buyer leverage, new construction keeping sellers honest, and builder incentive packages that represent real value if you take the time to scrutinize them. These are not the same negotiation, and treating them as such will cost you money in one direction or the other.
Renters have benefited from the same supply wave that softened ownership prices, but the best of that window appears to be closing. Concessions are still available but thinning. The rent-versus-buy math, done honestly with current rates and Travis County’s actual tax burden, doesn’t produce a clean answer for most households at $120,000. That ambiguity is uncomfortable, but it rewards careful analysis over urgency—and it should make you suspicious of anyone presenting a simple answer. For a wider view of how these conditions play out across the region, this article is part of our Austin housing and real estate coverage.
Fall showings pick up in earnest in September, when the heat breaks and buyers who paused for school calendars come back. That’s the next meaningful shift. Between now and then, August is a negotiating window for buyers patient enough to be shopping in the lull—particularly in suburban markets, where sellers who didn’t close before August are already eyeing another price cut. It’s not glamorous timing, but it’s genuinely useful. In this market, that’s about as close to an opening as you’re going to get.
CityDesk Austin uses ABOR market report data, Austin DSD permit records, Travis Central Appraisal District published rates, and on-record interviews with independent buyer’s agents for all figures in this article. Mortgage rate references reflect Freddie Mac Primary Mortgage Market Survey averages current to publication. Specific property details are drawn from Austin MLS records and have been lightly anonymized at agent request.