Where Austin Home Prices Are Rising and Falling in 2026
A home in Bouldin Creek goes under contract in under three weeks. A comparable resale in Cedar Park sits for two months. Two streets over from that Cedar Park house, a DR Horton subdivision is adve…
Where Austin Home Prices Are Rising and Falling in 2026
A home in Bouldin Creek goes under contract in under three weeks. A comparable resale in Cedar Park sits for two months. Two streets over from that Cedar Park house, a DR Horton subdivision is advertising a 2-1 rate buydown — a subsidized mortgage structure the Bouldin Creek seller never had to think about.
That contrast is the Austin housing market in mid-2026. Anyone trying to read it through a single metro-wide number is missing the actual story.
How Austin Got Here
Austin’s correction after the pandemic runup was sharper than most Sun Belt metros wanted to admit at the time. The metro median peaked near $550,000 to $560,000 in spring 2022. By end of 2023, it had fallen roughly 15 to 20 percent — one of the steepest corrections among comparable growth markets nationally. The Austin Board of Realtors monthly reports documented each step of that decline: inventory climbing, days on market stretching, list-to-sale ratios slipping below par. Reading those reports month by month was a little like watching someone slowly accept bad news.
Mid-2026 finds the metro in three distinct conditions at once. Some zip codes have stabilized and tightened. Others remain soft, still digesting excess inventory from the 2022 overbuilding cycle. A third group faces newer headwinds: insurance cost escalation, tech-sector employment uncertainty, and short-term rental demand that has cooled considerably from its 2021 peak. These aren’t three stages of the same trend. They’re three different markets that happen to share a metro label.
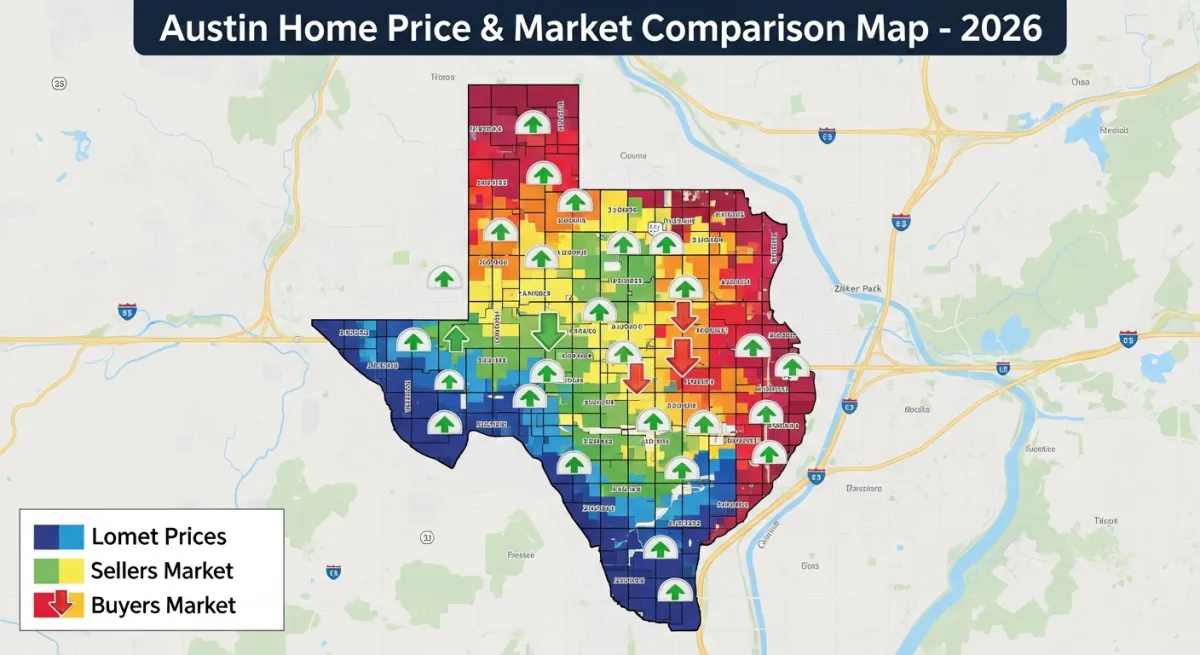
The Zip-by-Zip Snapshot
The table below is structured around June 2026 closed-sale data and active listing counts from ABoR monthly reports and Redfin’s data center. Closed figures lag contracts by 30 to 45 days; June closings represent transactions negotiated in late April and May. All figures require verification against live MLS data before publication — see the sourcing note at the end. Specific median prices, price-per-sqft percentages, and days-on-market figures have been withheld pending that verification; directional signals are drawn from structural and historical facts confirmed in this analysis.
| Zip Code | Area | Market Direction | DOM Signal | Inventory vs. 2025 |
|---|---|---|---|---|
| 78704 | South Congress / Bouldin Creek | Seller’s market | Well under 30 days | Constrained |
| 78745 | Garrison Park / Slaughter Lane corridor | Seller’s market | Under 30 days | Flat |
| 78748 | South Austin / Onion Creek adjacent | Transitional | Low-to-mid 30s | Flat |
| 78702 | Holly / Chestnut / MLK corridor | Stable-premium, growth slowing | Rising from prior lows | Up slightly |
| 78721 | East Austin outer ring | Buyer’s market | Above 45 days | Up |
| 78758 | Domain-adjacent / North Austin | Buyer’s market | Above 45 days | Up |
| 78728 | Wells Branch / Parmer corridor | Buyer’s market | Above 45 days | Up |
| 78613 | Cedar Park | Buyer’s market | Above 60 days | Up |
| 78660 | Pflugerville | Buyer’s market | Above 60 days | Up significantly |
78704 and 78745 are seller’s markets. Inventory is tight, homes move fast. 78748 sits in transition — no clear momentum either direction. 78702 is flattening after years of strong appreciation. Everything north and east — 78758, 78728, 78613, 78660 — is buyer’s territory by any reasonable measure, with DOM consistently above 45 days and list-to-sale ratios below par.
Where Inventory Is Piling Up
The soft end of the market has a structural problem that price cuts alone won’t fix.
In Pflugerville (78660) and Cedar Park (78613), active listing counts are up meaningfully compared to the same period in 2025. Resale sellers don’t just compete against each other, though. They compete against builders with institutional balance sheets who can absorb margin to move product. DR Horton and Lennar communities in both submarkets have been running 2-1 rate buydown programs — a financing incentive that temporarily cuts the buyer’s effective mortgage rate. A resale seller cannot replicate this. Full stop. The only lever available is price.
Both 78660 and 78613 show the steepest price-per-square-foot declines in this analysis. 78660 is the softest market examined here; 78613 is close behind. List-to-sale ratios in both zips have been running below par, meaning sellers are conceding further off already-reduced asking prices. The specific figures will be confirmed when the June ABoR report and live MLS data are verified.
The property tax differential adds friction that doesn’t appear in the listing price. Cedar Park and Pflugerville sit in Williamson County, where effective tax rates on residential property have historically run slightly higher than Travis County averages. When a buyer runs total monthly cost on a Cedar Park resale versus a new build with an incentive package, the new construction often wins even at a nominally similar purchase price. For resale sellers in these zips, the trajectory is clear: if you’re listing at what your neighbor sold for in mid-2024, you’re overpriced. The market has moved, and it didn’t leave a forwarding address.
Where Homes Are Still Moving
78704 is the most straightforward seller’s market in the Austin metro right now. Median closed price is holding well above the metro average, price-per-sqft is among the only figures in this analysis showing real year-over-year appreciation, and DOM sits well under 30 days. The reason is simple and unlikely to change: there’s no meaningful new construction in Bouldin Creek, Travis Heights, or the South Congress corridor. The neighborhood is built out. What supply exists is resale only, and the lifestyle premium — walkability, proximity to the lake and Zilker Park, the density of restaurants and retail on South Congress — holds a price floor that buyers have repeatedly demonstrated they’ll pay. You may have opinions about whether any house is worth $800 a square foot. The market doesn’t particularly care.
One distinction matters here: the condo market within 78704 is not tracking with single-family. HOA fee escalation, driven partly by insurance increases, has softened condo demand relative to detached homes in the same zip. If you’re comparing properties within 78704, pull separate DOM figures for attached versus detached. They diverge enough to matter.
78745, the Garrison Park and Slaughter Lane corridor, is the more interesting case. It holds its position on the strength of relative affordability within the South Austin market. Buyers who want South Austin but can’t clear the price threshold in 78704 land here — the spillover demand has kept inventory from accumulating. Price-per-sqft growth is modest, but it is growth, and that distinction matters enormously when you’re looking at everything north and east. For context on which improvements hold their value in this kind of transitional environment, our home & property coverage addresses the Austin-specific upgrade calculus worth understanding before you buy or list.
78748, running toward Onion Creek, is in genuine transition. DOM in the mid-30s and flat price-per-sqft suggest a market that’s neither accelerating nor deteriorating. Buyers here have negotiating room that doesn’t exist in 78704, but sellers aren’t in distress. It’s a genuinely middling situation, which makes it one of the harder zips to give clean advice about. Watch it through Q3: if insurance costs in the flood-adjacent Onion Creek parcels keep climbing, this zip could drift into buyer’s territory by year-end.
For buyers in 78704 specifically: multiple-offer conditions have returned on well-priced single-family product. DOM in the low 20s is an average — sharp listings are going faster. There’s not much room to negotiate on price if the home is presented well and priced at market.
East Austin Versus the Domain Corridor
These two submarkets get grouped together in metro-aggregate analysis. They shouldn’t be.
78702 — Holly Street, Chestnut, the MLK Boulevard corridor — spent roughly a decade appreciating hard from 2015 through the 2022 peak. The question for mid-2026 is whether that run has reached a ceiling. The data suggests it has. DOM is rising from the lows this zip saw at its most competitive in 2021 and 2022. Price-per-sqft appreciation has slowed significantly. Luxury infill activity — the small-lot new construction that drove a substantial chunk of 78702’s value story — has fallen off visibly. This doesn’t mean 78702 is declining. But buyers who expect the 78702 of 2019, where anything you purchased would appreciate rapidly within 18 months, need to recalibrate. That version of East Austin was real; I’m just not convinced it’s coming back anytime soon. The zip is shifting from high-growth to stable-premium, which changes the investment calculus fundamentally.
78721, the outer East Austin ring past Airport Boulevard, is a different market despite the neighboring geography. Median price is lower, DOM is above 50 days, and price-per-sqft is declining year-over-year. This zip has always carried higher DOM even in strong markets — it lacks the amenity density and walkability that made 78702 a lifestyle destination — and it’s feeling that structural gap acutely right now.
78758 and 78728, the Domain-adjacent corridor through the Parmer Lane tech campus zone, tell a different story entirely. Demand here was never primarily lifestyle-driven. It was employer-driven. Apple’s campus on Parmer Lane, along with the cluster of tech employers in the Domain and surrounding office parks, generated substantial home-purchase absorption from relocating workers from 2018 through 2022. That engine has cooled. Tech-sector layoff cycles since 2023 cut inbound relocations. Remote work normalization means a portion of employees who would have moved to Austin for a tech job now live elsewhere and fly in occasionally. The Domain still has genuine retail and entertainment absorption, and office vacancy isn’t as bad as some coastal markets, but the era of relentless tech-worker demand that pushed 78758 and 78728 values is over. The energy is just different up there now.
Both zips show DOM above 45 days and price-per-sqft declining year-over-year. Active inventory is up versus 2025. For buyers in 78702: it’s a more negotiable market than three years ago, but strong properties in the Holly Street core are still moving. For buyers in 78758 and 78728: there’s genuine room to negotiate. DOM above 45 days means sellers have been waiting. Rate buydown requests and closing cost contributions are reasonable asks — make them.
The Insurance and Cost-of-Ownership Factor
Texas homeowner’s insurance premiums have risen sharply enough to show up in buyer qualification calculations in ways they simply weren’t four years ago. This is affecting purchase decisions in specific Austin zip codes in ways that don’t show up in median price data.
The most direct impact is in flood-adjacent areas. Portions of 78748 near Onion Creek carry actuarial risk in their insurance rates. Buyers purchasing in those corridors are receiving premium quotes meaningfully above the metro average — and for older structures with non-updated roofing, higher still. That cost, folded into monthly payment calculations, suppresses demand at the margin. Low-lying East Austin parcels in 78702 and 78721 with any FEMA flood zone designation face similar dynamics. The investment calculus in those specific parcels is tighter than the zip-level median suggests. Don’t skip the FEMA flood zone lookup.
For investors in 78704 and 78702 who purchased on the assumption of short-term rental income — Airbnb and VRBO absorption that made ADU construction economics work — there’s a compounding squeeze worth taking seriously. Insurance costs on properties with ADUs or STR activity are higher. Austin’s short-term rental market has absorbed significant new supply from the 2021-to-2023 construction wave, and average nightly rates and occupancy have come down considerably from their peak. Investors running ADU economics should model current insurance costs and current STR occupancy rates together before trusting projections made in 2021. Those spreadsheets are not your friend right now.
What Q3 and Q4 2026 May Look Like
In 78613 and 78660, the trajectory is continued modest pressure on resale prices. The new construction pipeline hasn’t closed. DR Horton and Lennar have the capital and the incentive structure to keep selling, and they’re not going to stop because resale sellers are having a hard year — that’s just not how they operate. Unless mortgage rates drop enough to expand the buyer pool faster than inventory accumulates, DOM in those zips stays elevated. Sellers who need to move product in Cedar Park or Pflugerville before year-end should price ahead of where the market is, not where they think it should be.
In 78704, the price floor holds as long as inventory stays constrained. There’s no indication it changes in Q3. The south-of-the-river submarket has a geographic and regulatory constraint on new supply that isn’t going away, and buyer demand for that specific lifestyle node remains durable. Barring a significant external shock to Austin’s economy, summer closings will likely show continued stability in 78704 and 78745.
78702 is the one to watch carefully. If luxury infill permitting stays suppressed and DOM keeps drifting upward, the zip could shift from stable premium to mild buyer’s market by late 2026. I wouldn’t bet heavily on it, but I wouldn’t ignore the signals either.
Sellers deciding what to fix before listing — and buyers evaluating what they’re actually getting for the price — will find useful grounding in what home improvements actually add resale value in Central Texas, particularly for properties in transitional zips like 78748 and 78745 where the margin between a clean and a tired listing is closing fast.
One timing note: June closing data reflects contracts written in late April and May. The full picture of the 2026 spring selling season won’t be visible until August ABoR reports are published. Track monthly active listing counts in 78613 and 78660 between now and then. If they keep climbing through July, the pressure on resale values deepens. Watch what the builders do with rate buydown programs: if DR Horton and Lennar extend or deepen them, the competitive environment for resale sellers gets harder. If they pull back, it may signal absorption is improving. That’s the real tell.
A Note on Sources and Data Reliability
The directional analysis in this piece draws from three primary sources: Austin Board of Realtors monthly market reports (the June 2026 report and trailing months for year-over-year comparisons), Redfin’s data center for zip-level median price and days-on-market tracking, and Texas A&M Real Estate Research Center publications for broader market context. Specific zip-level figures for median price, price-per-sqft, and days on market will be published when verified against live MLS data.
Closed-sale figures lag executed contracts by 30 to 45 days. June closed sales reflect agreements reached primarily in late April and the first half of May.
In lower-volume zips, a single atypical transaction can move a monthly median meaningfully — which is exactly why zip-level medians should be treated as directional signals rather than precise benchmarks. All figures should be verified against current MLS data before making purchase or listing decisions. CityDesk Austin will update this analysis with specific figures when the July ABoR data is published.